Monday morning, S&P 500 futures were in the green and many small cap stocks were seeing strong gains on the hopes of further capital inflows to stocks and away from bonds as retail investors grow comfortable with equities again. In a blog post, Josh Brown or “the Reformed Broker” discussed how this marks a significant change in the cycle of the market. While he doesn’t suggest what is going to happen next, it is clear that our bull market has entered a new phase.
If we accept as fact that retail investors are flowing more and more dollars into stocks, then we would expect stocks to rise and continue to rise. The price of the S&P 500 seems to confirm that suspicion—SPY is up almost 27% YTD.
A macro, sentiment-oriented trader would approach this new market in two ways. First, there is the momentum play, where you bet bullish and ride the rising tide. However, this rising tide cannot last forever, and the reintroduction of retail investors to the market is often an indicator of the beginnings of a bubble. So, the second move for traders would be to bet bearish for future corrections and a crash.
One way to think about this is to look at trading volumes—if they are rapidly increasing or decreasing, then we would expect conviction to be high. Larger volumes means more overall interest in playing the market, whether bullish or bearish—more people see equities as the place where the action is. Smaller volumes, on the other hand, is a sign of squeamishness—mere uncertainty in what exactly is going to happen to the market in the near term.
A quick glance at SPY shows that volumes are trending slightly downwards:
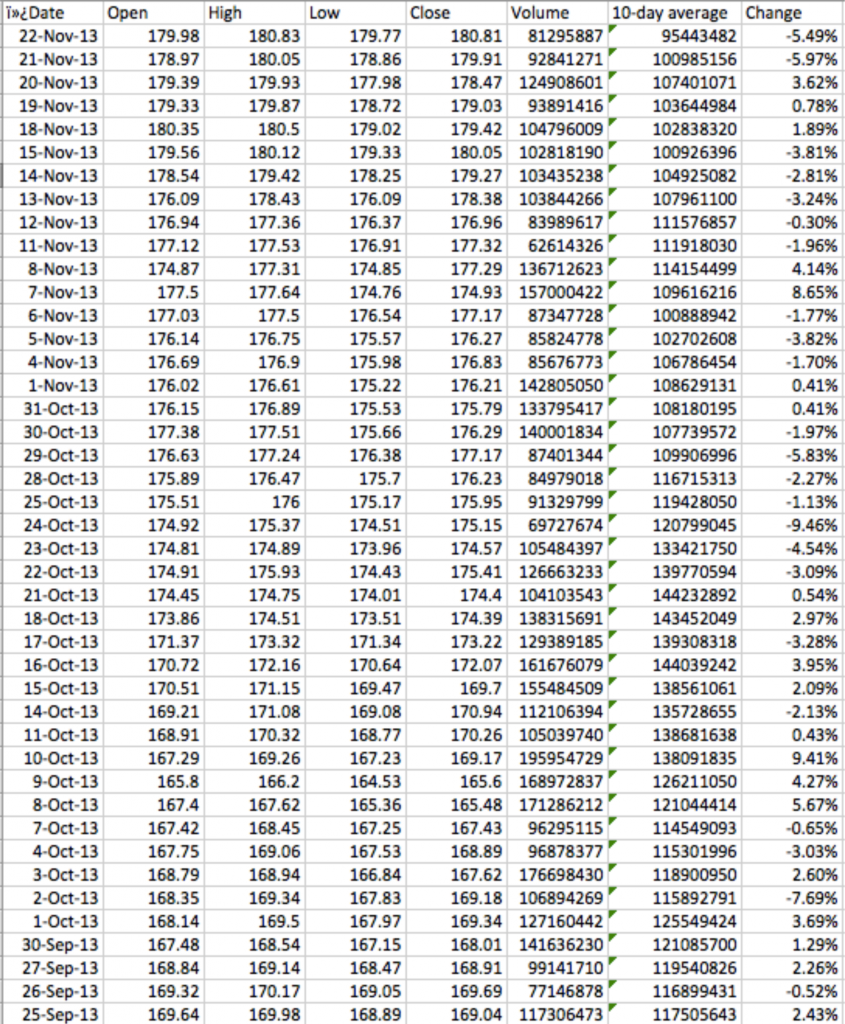
The last column shows the day-to-day changes in volume which mean little on their own, but a definite pattern in one direction or another can indicate overall market trends. We see mostly negative single-digit numbers for the past two months, showing a gradual and by no means extreme decrease in market interest in stocks.
Let’s compare this to the same period in 2012, when the market was just recovering from a dip caused by systemic fears:
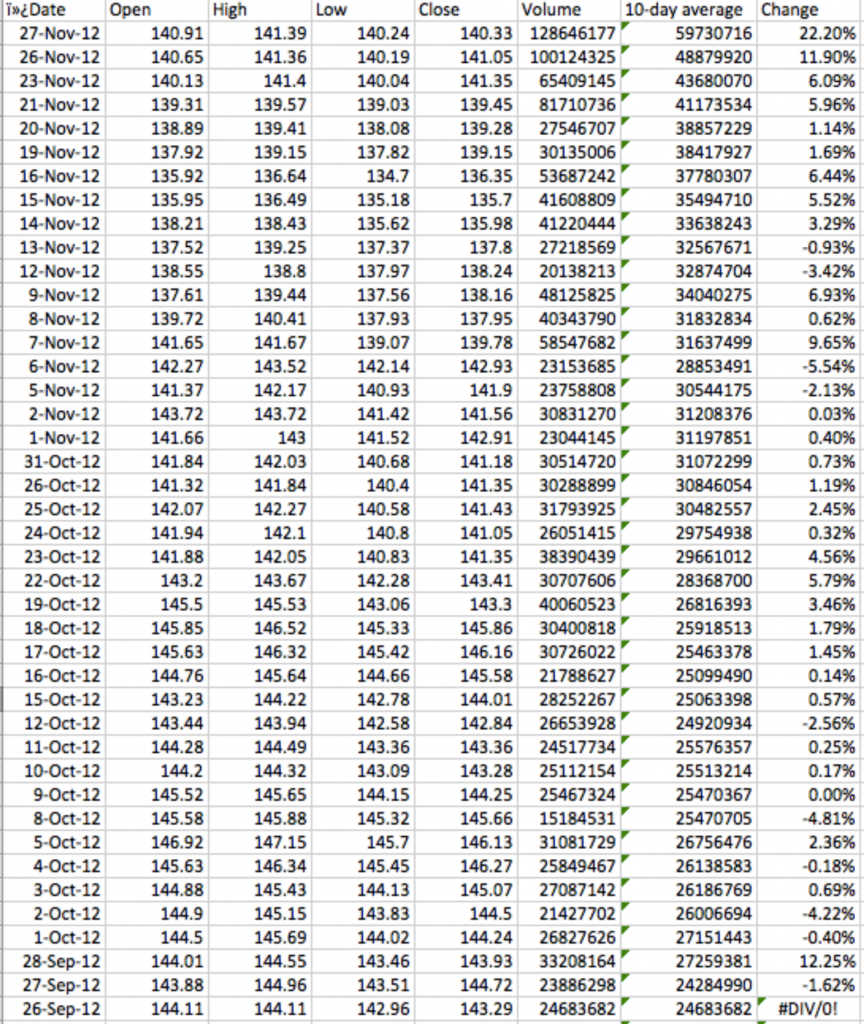
Here we see mostly day-to-day increases, with a spike in interest at the end of the period as relief overcame fear and more capital flowed into stocks.
It is not easy to interpret this information, but it is clear that the market is not seeing a surge of interest in stocks—nor a surge of fear that stocks will decline. If we connect this data to price performance, an interesting conclusion emerges.
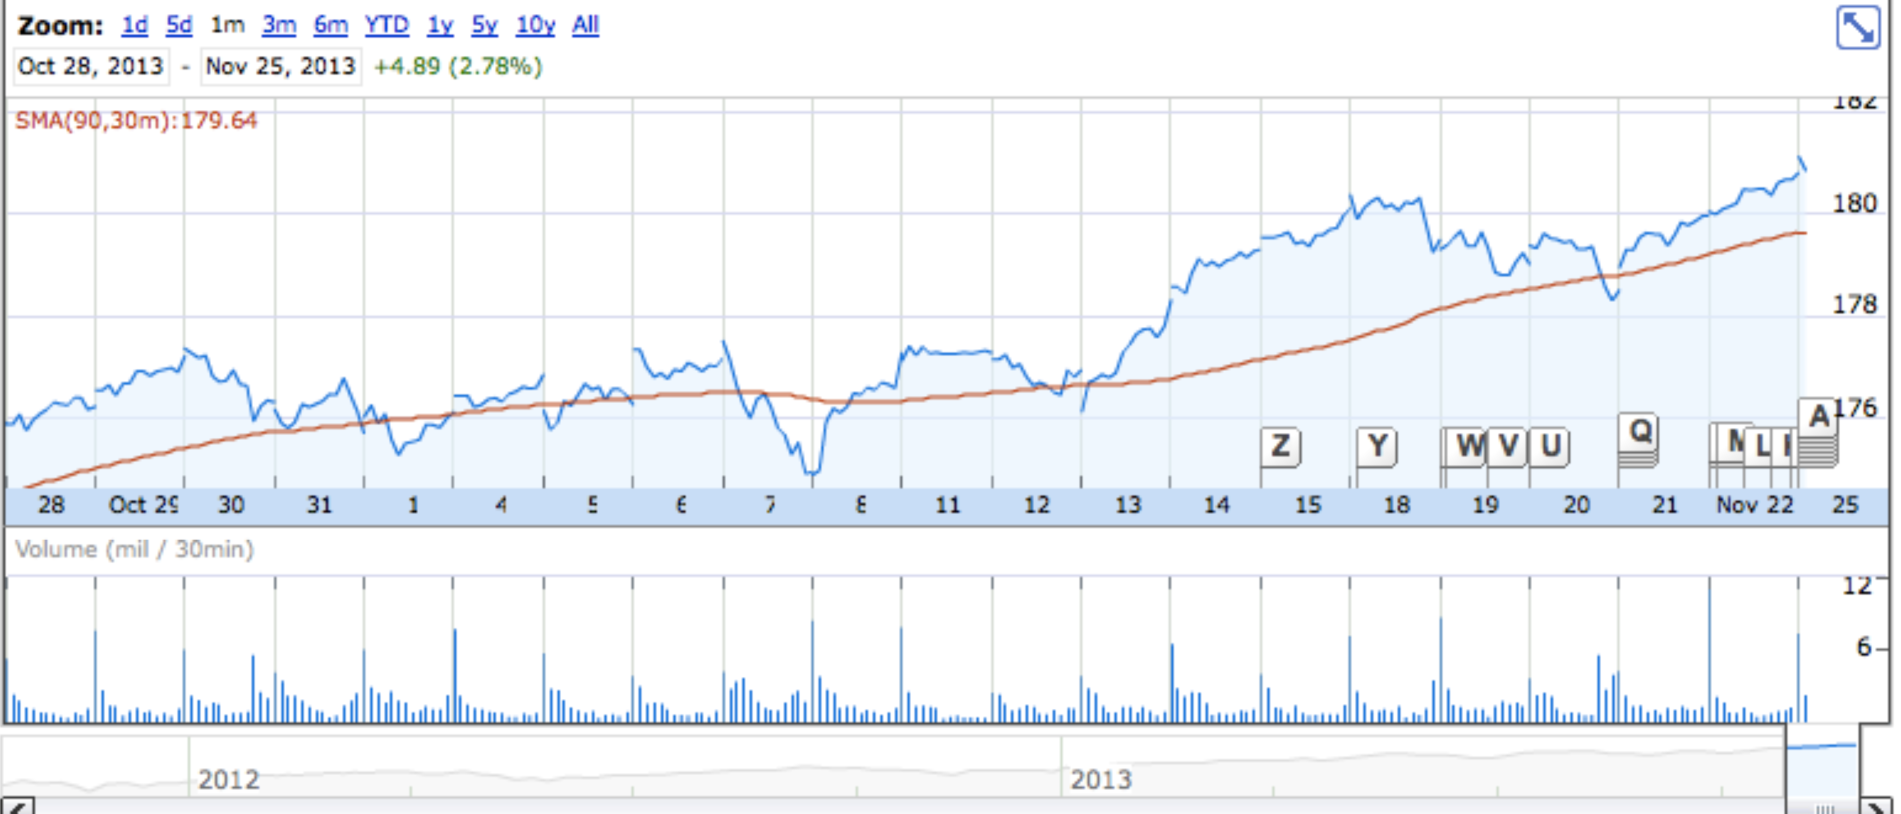
Click on image to zoom
Looking at the past month, SPY has done well, but the most dramatic days were the 13th and the 21st, which were not days of steep volume increases. Likewise, the past couple of weeks have had steadier trendlines in terms of price, but there haven’t been volumes to back that up. If nothing else, this suggests that overall demand to trade SPY is low, meaning there are not many expectations of a major price change in the market in the next coming months.
Of course, the market often is wrong, and a major correction may just be on the horizon. But the story that stock prices and volumes are telling us, at least in the case of SPY, is that the market is very slightly uncomfortable with this bull market, or at least is not expecting a very strong bull market in the future.